| |
| Plant Hardiness Zone Maps for the United States and Canada | |
Below you will find a variety of plant hardiness
zone maps for the United States. These maps also
show the average annual minimum temperature
throughout North America. Your local nursery,
most garden centers, as well as seed, plant and
tree catalogs usually show the plant zone for
many of the bushes, flowers, vegetables and fruit
trees they offer. Although buying perennials
suited to your local climate will not guarantee
100 per cent success with your plantings, it
will substantially improve the chances of
their surviving for years to come.
How to use these maps
Find the color of your local plant zone by scanning
the regional plant zone maps to pinpoint your
location. Now consult the color-coded chart at
the left of the North American plant hardiness
zone map to determine the numeric zone. Use your
precise local plant zone to find flowers, vegetables
and shrubs most appropriate for your area.
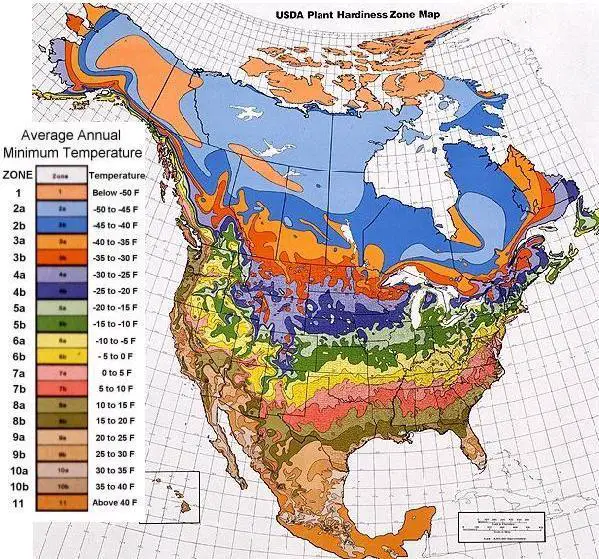
U.S.D.A. plant hardiness zones 2-10 on this map
have been subdivided into light and dark-colored
sections (a and b) that represent 5° F (2.8° C)
differences within the 10° F (5.6° C) zone. The
light color of each zone represents the colder
section; the dark color, the warmer section.
Zone 11 represents warmer areas where the average
annual minimum temperature is above 40° F (4.4° C)
and are therefore essentially frost-free. Each
of these zones represents an area of winter
hardiness for the plants of agriculture and
our natural landscape.
Areas located at an extremely high elevation are
traditionally considered unsuitable for planting
crops and thus may not bear appropriate zone
designations. There are also island zones that,
because of elevation differences, are warmer or
cooler than the surrounding areas and are given
a different zone designation. Note that many
large urban areas carry a warmer hardiness zone
designation than the surrounding countryside.
These maps contain as much detail as possible,
considering the vast amount of data on which
they are based and their size.
In addition to finding the appropriate landscaping
for your local plant hardiness zone, gardeners
should keep in mind the following:
* Stress Factors - Acid rain, gaseous and
particulate pollution, security lighting, and
toxic wastes, among many other stress factors,
have significantly increased the potential for
unsatisfactory performance of landscape plants.
* New Plant Management Systems - New techniques
of planting, transplanting, watering, fertilizing,
and providing pest control measures have done
much to increase the vigor of landscape plants.
But used unwisely, these same measures can actually
reduce plant hardiness.
* Artificial Environments - We
have pushed the use of plants into totally
artificial environments such as malls, rooftop
gardens, elevated decks, and buildings where
plant roots are totally removed from the ground
and its warming influence. The assortment of
plants that can adapt to such environments is
proving to be rather limited. Hardiness ratings
alone are inadequate to guide landscapers in
selecting the most successful plants for these
artificial environments.
| |
| | North American Plant Hardiness Zone Map | |
This newer version of the U.S. Department of
Agriculture plant hardiness zone map supersedes
the 1965 version. The new edition shows
in detail the lowest temperatures that can
be expected each year in the United States,
Canada, and Mexico. These temperatures are
referred to as "average annual minimum
temperatures" and are based on the lowest
temperatures recorded for each of the years
1974 to 1986 in the United States and Canada,
and 1971 to 1984 in Mexico.
Note: The minimum temperatures shown on this
map are the average minimum temps. Keep in mind that
temperatures can and occasionally do get
colder than indicated on this map.
U.S.D.A. Plant Hardiness Zone Map for North America
| |
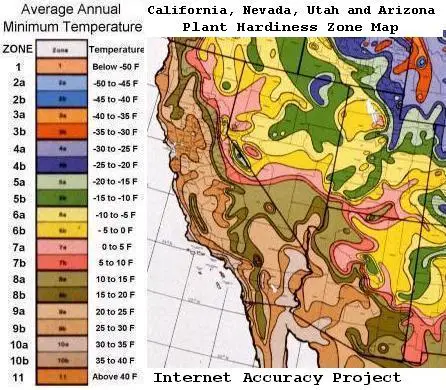
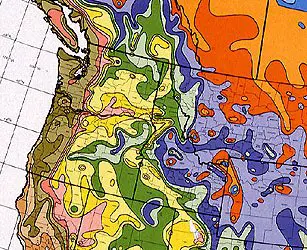
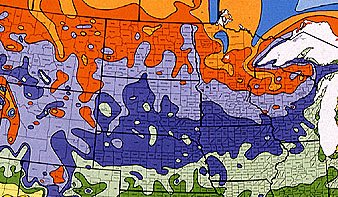
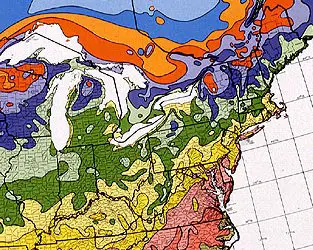
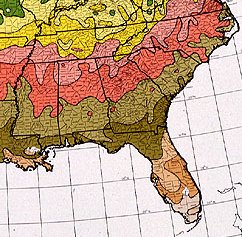
| | Regional Plant Hardiness Zone Maps |
California, Nevada, Utah and Arizona
Washington, Oregon, Idaho, Montana and Wyoming
Montana, Wyoming, North Dakota, South Dakota,
Minnesota, Wisconsin, Iowa, Nebraska and Illinois
Colorado, New Mexico, Kansas, Oklahoma, Texas,
Missouri, Illinois, Arkansas, Louisiana and Mississippi
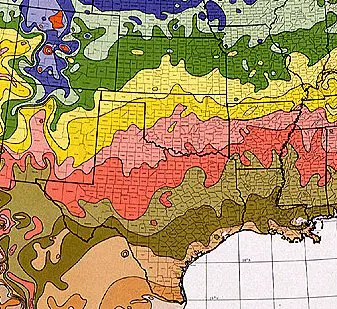
Connecticut, Delaware, Indiana, Kentucky, Maine,
Maryland, Massachusetts, Michigan, New Hampshire,
New Jersey, New York, Ohio, Pennsylvania,
Rhode Island, Vermont, Virginia and West Virginia
Alabama, Florida, Georgia, Mississippi,
North Carolina, South Carolina and Tennessee
|
1 |
Below -50 F
|
Below -45.6 C
|
Fairbanks, Alaska; Dawson, Yukon, Canada |
|
2a |
-50 to -45 F
|
-42.8 to -45.5 C |
Prudhoe Bay, Alaska; Lynn Lake, Manitoba, Canada |
|
2b |
-45 to -40 F
|
-40.0 to -42.7 C |
Unalakleet, Alaska; Koyuk, Alaska; Carp, Minnesota |
|
3a |
-40 to -35 F
|
-37.3 to -39.9 C |
St. Michael, Alaska; Warroad, Minnesota |
|
3b |
-35 to -30 F
|
-34.5 to -37.2 C |
Chester, Montana; Tomahawk, Wisconsin |
|
4a |
-30 to -25 F
|
-31.7 to -34.4 C |
Lewistown, Montana; Minneapolis/St. Paul, Minnesota |
|
4b |
-25 to -20 F
|
-28.9 to -31.6 C |
Taylor, Nebraska; Dickens, Iowa; Lancaster, Wisconsin |
|
5a |
-20 to -15 F
|
-26.2 to -28.8 C |
Crook, Colorado; Fairfield, Iowa; Rock Island, Illinois |
|
5b |
-15 to -10 F
|
-23.4 to -26.1 C |
Columbia, Missouri; Mansfield, Pennsylvania |
|
6a |
-10 to -5 F
|
-20.6 to -23.3 C |
Dalhart, Texas; Shaw, Kansas; St. Louis, Missouri |
|
6b |
-5 to 0 F
|
-17.8 to -20.5 C |
Clovis, New Mexico; Hartsville, Tennessee; Branson, MO. |
|
7a |
0 to 5 F
|
-15.0 to -17.7 C |
Oklahoma City, Oklahoma; South Boston, Virginia |
|
7b |
5 to 10 F
|
-12.3 to -14.9 C |
Wink, Texas; Little Rock, Arkansas; Griffin, Georgia |
|
8a |
10 to 15 F
|
-9.5 to -12.2 C |
Dallas, Texas; Jackson, Alabama; Tifton, Georgia |
|
8b |
15 to 20 F
|
-6.7 to -9.4 C |
Austin, Texas; Gainesville, Florida; Two Egg, Florida |
|
9a |
20 to 25 F
|
-3.9 to -6.6 C |
Devils Den, CA.; Houston, Texas; St. Augustine, FL. |
|
9b |
25 to 30 F
|
-1.2 to -3.8 C |
Blythe, California; Brownsville, Texas; Fort Pierce, FL. |
|
10a |
30 to 35 F
|
1.6 to -1.1 C |
Glamis, CA; Naples, Florida; Marco Island, Florida |
|
10b |
35 to 40 F
|
4.4 to 1.7 C |
Miami, Florida; Coral Gables, Florida |
|
11 |
above 40 F
|
above 4.5 C |
Honolulu, Hawaii; Mazatlan, Mexico |
Visit our page of freezing temperature climate maps
to determine the mean date of last freezing
temperatures, the mean date of first freezing
temps, the median length of freeze-free period,
and the annual precipitation for your area.
| |
| |
If you find the above data useful, please
link to this page from your webpage, blog or
website.
Alternatively, consider recommending us to
your friends and colleagues. Thank you in
advance! | |
Copyright © 2005-2012 INTERNET ACCURACY PROJECT. All rights reserved. All
content, is the exclusive property of Internet Accuracy Project
and may not be reproduced (on the Web, in print, or otherwise)
without the express written permission of our organization.
BY ACCESSING THIS SITE YOU ARE STATING THAT YOU AGREE TO
BE BOUND BY OUR TERMS AND CONDITIONS
regardless of whether you reside in the United States of
America or not. Our Privacy Policy.
This page was last updated January 1, 2012.
| |
| |